SQL Case Study on Zomato Dataset
A case study that answers various data analytics questions using SQL on the Zomato dataset.
Introduction
I have solved 20 data analytics questions by running SQL queries on the Zomato dataset. I will explain in detail how I constructed these queries to solve the questions.
Database Schema Overview
This SQL case study is based on a simplified simulation of the Zomato platform. The schema consists of seven interrelated tables, each capturing key entities and interactions:
users
Stores registered user details.
| Column | Description |
|---|---|
user_id | Unique ID for each user |
name | User's name |
email | User's email address |
password | Encrypted or hashed password |
Table 1: Schema of users table.
restaurants
Basic information about restaurants listed on the platform.
| Column | Description |
|---|---|
r_id | Unique restaurant ID |
r_name | Restaurant name |
cuisine | Type of cuisine (e.g., Indian) |
Table 2: Schema of restaurants table.
food
Catalog of all available food items.
| Column | Description |
|---|---|
f_id | Unique ID for each food item |
f_name | Name of the food item |
type | Category (e.g., veg, non-veg, drink) |
Table 3: Schema of food table.
menu
Maps restaurants to the food items they offer.
| Column | Description |
|---|---|
menu_id | Unique ID for each menu entry |
r_id | Foreign key to restaurants(r_id) |
f_id | Foreign key to food(f_id) |
price | Price of the food item |
orders
Captures overall order metadata.
| Column | Description |
|---|---|
order_id | Unique ID for each order |
user_id | Foreign key to users(user_id) |
r_id | Foreign key to restaurants(r_id) |
amount | Total order value |
date | Order date |
partner_id | Foreign key to delivery_partner(partner_id) |
delivery_time | Delivery duration in minutes |
delivery_rating | Rating of delivery experience |
restaurant_rating | User’s rating of the restaurant |
Table 5: Schema of orders table.
delivery_partner
Details about the delivery staff.
| Column | Description |
|---|---|
partner_id | Unique ID for each delivery partner |
partner_name | Name of the delivery partner |
Table 6: Schema of delivery_partner table.
order_details
Line items within each order.
| Column | Description |
|---|---|
id | Unique ID for the record |
order_id | Foreign key to orders(order_id) |
f_id | Foreign key to food(f_id) |
Table 7: Schema of order_details table.
ER Diagram
Figure 1 shows the ER diagram of this database.

Answering the Questions
Selecting the Database
This is a pretty trivial question which deals with selecting the database we are working with. This is particularly convenient when we have multiple databases in our system. Normally if we want to view all the columns of a particular table in a database, we run the following query:
SELECT *
FROM <database_name>.<table_name>;
However if we select the database we want to work with using by running
USE <database_name>;
then we can select all the columns of a particular table in the same database by running
SELECT *
FROM <table_name>;
The name of our database is Zomato. So we select this database by running the following query:
USE Zomato;
Counting the Number of Rows
It is always a good idea to know the number of observations present in each table of the database. The following query gives this result:
SELECT COUNT(*)
FROM <table_name>;
The output given by running this query for each of the tables is shown in Table 1.
| Table | Number of Rows |
|---|---|
| food | 11 |
| restaurants | 5 |
| users | 7 |
| delivery_partner | 5 |
| menu | 15 |
| orders | 25 |
| order_details | 50 |
Table 1: Number of rows returned by query for each table in the Zomato dataset.
This is analogous to using the shape property of a Pandas DataFrame.
Viewing some Random Number of n Records
Viewing rows randomly is useful to get a good idea of the distribution of rows in the data, which is not possible by just looking at the top n rows if the data is ordered. To do this, we run the following query:
SELECT *
FROM <table_name>
ORDER BY RAND()
LIMIT 5
The RAND function randomly orders the rows and the LIMIT 5 function shows only the top 5 rows of this randomly ordered rows. Note that the rows will be ordered in a different random order each time we run this query. This is analogous to the sample method of a Pandas DataFrame.
The rows in the tables of our Zomato database are not in any particular order. Hence, running this query didn’t particularly gave us anything more useful than running it without using the RAND function. However, I have still included the results in the following screenshots.
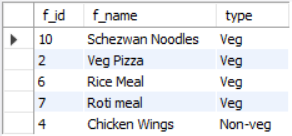
food table.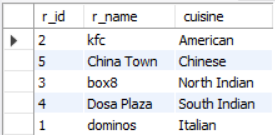
restaurants table.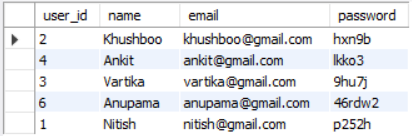
users table.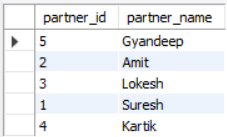
delivery_partner table.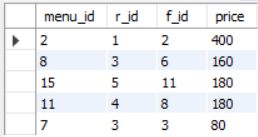
menu table.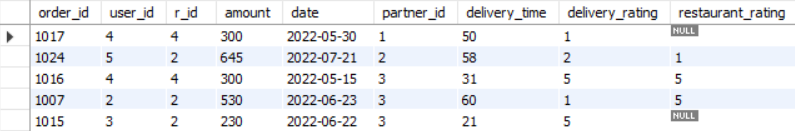
orders table.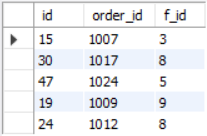
order_details table.Exploring NULL Values
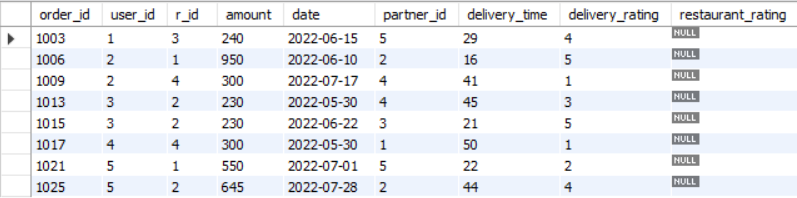
It is generally helpfull to view the rows with NULL values present. It can guide us on how we can try to impute them or if we should remove them all together. In the Zomato database, the only table containing NULL values is the orders table. The column restaurant_rating contains these NULL values, which is also evident from Figure 7. We can view all the rows containing these NULL values using the following query:
SELECT *
FROM orders
WHERE restaurant_rating IS NULL;
Figure 9 shows the output.
NULL values in the orders table.Similarly, for viewing all the rows not containing any NULL values, we can run the following query:
SELECT *
FROM orders
WHERE restaurant_rating IS NOT NULL;
If we want to fill these NULL values with zeros, we can run the following query:
UPDATE orders
SET restaurant_rating = 0
WHERE restaurant_rating IS NULL;
As filling the NULL values with zeros is unreasonable in this case, we won’t do it.
Finding the Number of Orders placed by Each Customer
We want to display a table with two columns. The first column should contain the customer name, and the second column should contain the number of orders they placed. From the ER diagram (Figure 1), we can see that the name of the customer is in the users table, and the number of orders can be found from the orders table using the COUNT function. So, we first need to join these two tables on their common column, which is user_id. To do this, we run the following query:
SELECT *
FROM users AS u
JOIN orders AS o
ON u.user_id = o.user_id;
The first few rows of this joined table is shown in Figure 10
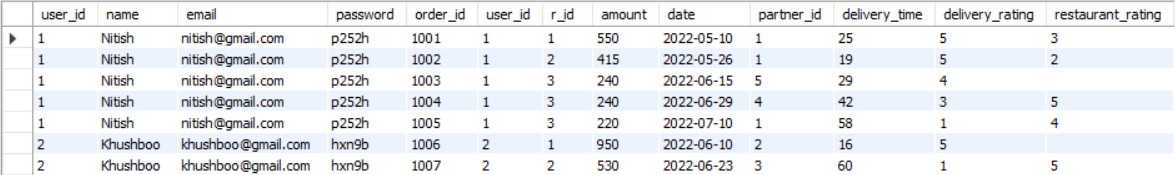
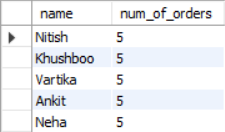
users and the orders table on their common column user_id.Now, we just need to group by the column user_id and apply the COUNT aggregate function on the column order_id. In the SELECT we will add the name column to display the name of the customer and also rename the column resulted from using the COUNT aggregation on order_id to num_of_orders. The query is the following:
SELECT u.name,
COUNT(o.order_id) AS 'num_of_orders'
FROM users AS u
JOIN orders AS o
ON u.user_id = o.user_id
GROUP BY u.user_id, u.name;
Note that we have also added the column u.name in GROUP BY so that we can also add it in the SELECT clause to view the customer name. As each customer (u.name) has a unique order_id, GROUP BY u.user_id, u.name and GROUP BY u.user_id will be the same. However, if we do the later, we won’t be allowed to view the customer name by adding it in the SELECT clause as it is not included in the GROUP BY clause. Hence we did the former.
Also, we didn’t grouped by only the customer name because we want to be cautious of the possibility of two customers sharing the same name. As user_id is unique for each customer, grouping by it will be more robust as compared to grouping by customer name.
The result of this query is shown in Figure 11.
Finding the Restaurant with Most Number of Menu Items
Again, we want to display a table with two columns and a single row. The first column being the name of the restaurant, and the second being the number of menu items. This single row should contain the name of the restaurant with the most number of menu items. From the ER diagram (Figure 1), we can see that the name of the restaurant is in the restaurants table, and all the information about menu items can be found in the menu table. So, we will first join these two tables on their common column, which is r_id. The following query does this:
SELECT *
FROM restaurants AS r
JOIN menu AS m
ON r.r_id = m.r_id;
The first few rows of the output of this query is shown in Figure 12.
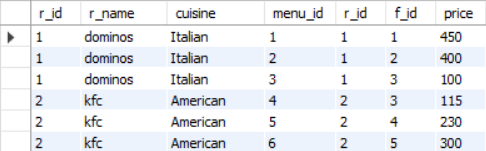
restaurants and the menu table on their common column r_id.Next, we will group by the columns r_id and r_name, and use the COUNT aggregation function on the f_id column. The query is the following:
SELECT r.r_name,
COUNT(m.f_id) AS 'num_of_menu_items'
FROM restaurants AS r
JOIN menu AS m
GROUP BY r.r_id, r.r_name;
Figure 13 shows the result of this query.
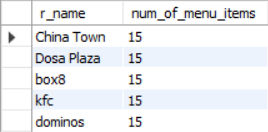
As all restaurants have the same number of menu items, the answer to this query is all restaurants. However if they number of menu items were different, we would have used ORDER BY and LIMIT in this query in the following way to get the restaurant with the most mumber of menu items:
SELECT r.r_name,
COUNT(m.f_id) AS 'num_of_menu_items'
FROM restaurants AS r
JOIN menu AS m
GROUP BY r.r_id, r.r_name
ORDER BY num_of_menu_items DESC
LIMIT 1;
Finding the Number of Votes and Average Rating for All the Restaurants
Here, we want the output table to contain three columns. The first one containing the restaurant name, the second containing the number of rating votes it received, and the third containing the average rating. From the ER diagram (Figure 1), we can see that the restaurant name is in the restaurants table, and the information regarding rating is in the orders table. We will have to join these two tables on their common column r_id, which is done by the following query:
SELECT *
FROM restaurants AS r
JOIN orders AS o
ON r.r_id = o.r_id;
The first few rows of the output of this query is shown in Figure 14.
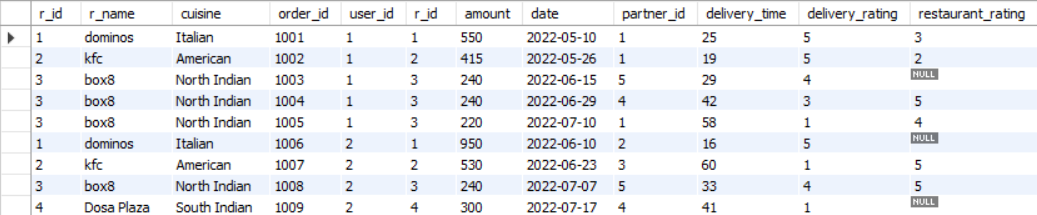
restaurants and the menu table on their common column r_id.Now, we can simply find the number of rating votes and the average rating received by the restaurant by using GROUP BY on the r_id column and then using the COUNT and the AVG aggregate functions on the restaurant_rating column. However, a slight problem here is that the restaurant_rating column contains NULL values. So we will filter out these NULL ratings using the WHERE condition. The final query is the following:
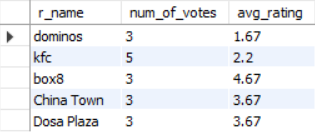
SELECT r.r_name,
COUNT(o.restaurant_rating) AS 'num_of_votes',
ROUND(AVG(o.restaurant_rating), 2) AS 'avg_rating'
FROM restaurants AS r
JOIN orders AS o
ON r.r_id = o.r_id
WHERE restaurant_rating IS NOT NULL
GROUP BY r.r_id, r.r_name;
Here, we have also used the ROUND function to display the average rating upto 2 decimal places for better readability. The output of this query is shown in Figure 15.
Finding the Food that is being sold at Most Number of Restaurants
We just want a single cell as the output which contains the name of the food that is being sold at most number of restaurants. In other words, we want to find the most popular food item. From the ER diagram (Figure 1), we can see that the name of the food items is present in the food table, whereas the information about in which restaurants the food is sold can be found from the menu table. So, we will first join these two tables on their common column which is f_id. The query for this is the following:
SELECT *
FROM food AS f
JOIN menu AS m
ON f.f_id = m.f_id;
A few rows from the output of this query is shown in Figure 16.
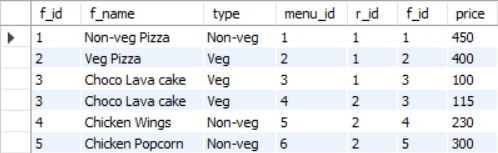
food and the menu table on their common column f_id.Now to find the food which is being sold in most number of restaurants, we will group by the column f_id, apply the COUNT aggregation function on the r_id along with ordering in descending order based on this COUNT aggregation. Finally, we will simply add a LIMIT clause to view the top food. The final query is the following:
SELECT f.f_name
FROM food AS f
JOIN menu AS m
ON f.f_id = m.f_id
GROUP BY f.f_id, f.f_name
ORDER BY COUNT(m.r_id) DESC
LIMIT 1;
The output of this query is the food item “Choco Lava cake”, which is the item that is sold in most number of restaurants.
Finding the Restaurant with Maximum Revenue in Each Month
We want the output to simply be a table with two columns. The first column should contain the month, and the second column should contain the name of the restaurant which had the maximum revenue in that particular month. From the ER diagram (Figure 1), we can see that the name of the restaurants can be found in the restaurants table, and the information about date is present in the orders table. So, we will first join these two tables on their common column r_id. The query for this is the following:
SELECT *
FROM restaurants AS r
JOIN orders AS o
ON r.r_id = o.r_id;
The first few rows of the output of this query is shown in Figure 17.
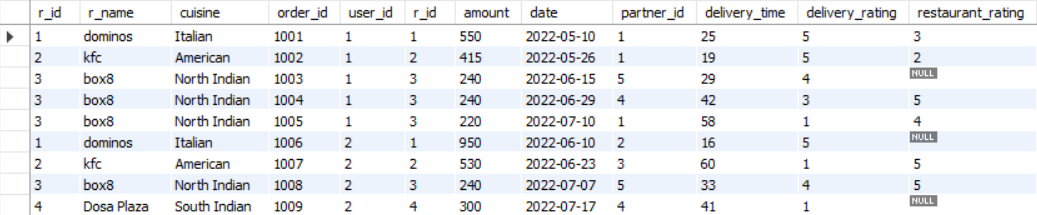
restaurants and the orders table on their common column r_id.We will first extract the month from the column date using the MONTHNAME function.
🚧 Work in Progress: This page is currently being written. Some sections are complete, while others are still under construction. Feel free to explore and check back later for updates!